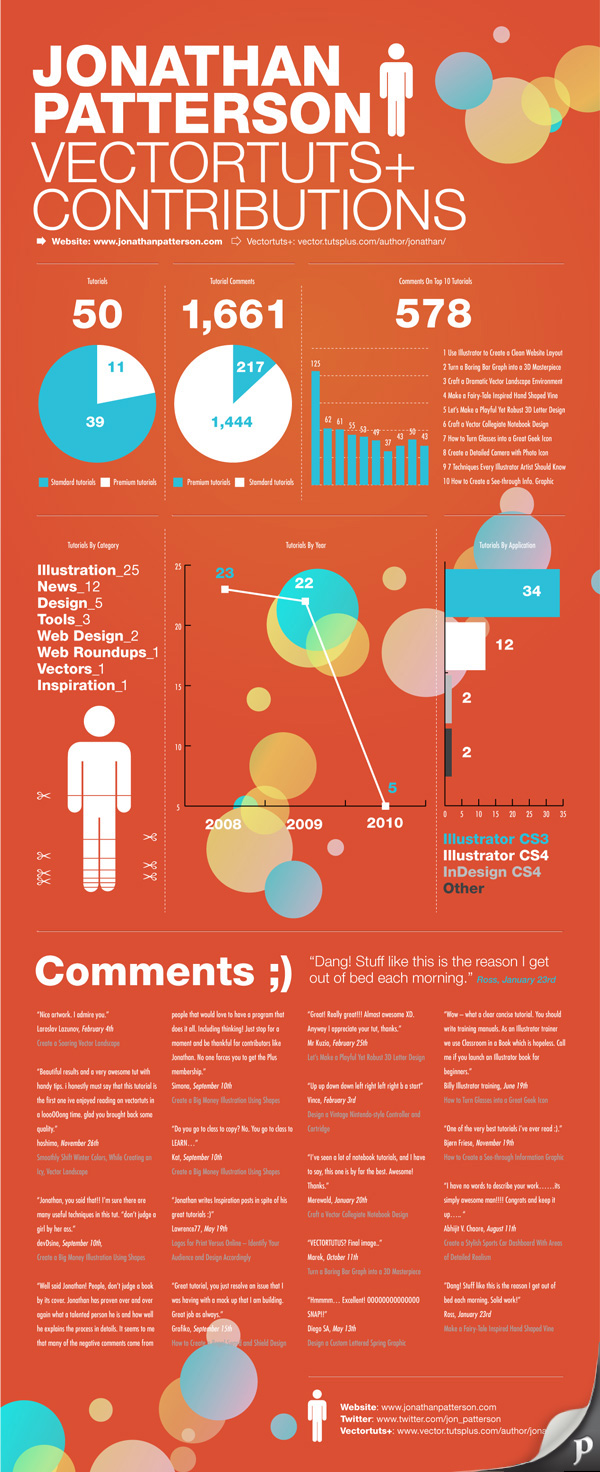
This post is mainly a point of reference for myself so sorry for the amount of links....
http://vector.tutsplus.com/tutorials/designing/how-to-create-outstanding-modern-infographics/
http://www.makeuseof.com/tag/awesome-free-tools-infographics/
Designing An Infographic
Some great tips for designing infographics:
- Keep it simple! Don’t try to do too much in one picture.
- Decide on a colour scheme.
- Research some great facts and statistics.
- Think of it as a visual essay: ensure your arguments hold and are relevant.
- Remember that it’s all about quickly conveying the meaning behind complex data.
- Draw conclusions.
- Reference your facts in the infographic.
- Include your URL so people can be sure who made it.
Ideas for infographic formats include:
- Timelines;
- Flow charts;
- Annotated maps;
- Graphs;
- Venn diagrams;
- Size comparisons;
- Showing familiar objects or similar size or value.
http://visual.ly/

